Human-Computer Interaction Course Note
Made by Mike_Zhang
Notice | 提示
个人笔记,仅供参考
PERSONAL COURSE NOTE, FOR REFERENCE ONLYPersonal course note of COMP3423 Human-Computer Interaction, The Hong Kong Polytechnic University, Sem1, 2022.
本文章为香港理工大学2022学年第一学期 人机交互(COMP3423 Human-Computer Interaction) 个人的课程笔记。Mainly focus on Human Information Processing, Visual Perception and Computer Graphics, Language & Communication & Dialogue, Ergonomics & IO Devices, and Testing.
Unfold Study Note Topics | 展开学习笔记主题 >
1 Introducing HCI
Software projects go over cost:
- Users requested changes
- Overlooking tasks
- Users did not understand their own requirements
- Insufficient user-developer communication and understanding
Too quickly into detailed design:
- Founded on incorrect requirements
- Has inappropriate dialog flow
- Is not easily used
- Is never tested until it is too late
Low risk, redesigned many times:
- Fail fast innovation
- Rapid prototyping, user testing
- Stakeholder co-design
High risk, redesign is costly:
- Traditional R&D
- Waterfall
- Agile software development
Usability:
- Product reviews emphasize usability (e.g., Consumer Reports)
- Interface has become an important element in garnering good reviews
- Customers have used related products, and can often download trial versions (including competitors’)
- Less emphasis on features: Today’s users are impatient and intolerant of bad design
Consequences of bad design:
- Costly errors in serious systems (e.g., financial institutes)
- Widespread effects (e.g., incorrect billing, failures)
- Life-critical systems (medical, air traffic control)
- Safety and security (in-car navigation systems, face-ID hacks)
Fitts’ Law:
The wider an interface widget and the closer it is to the pointer, the easier to hit it
- T: time to select a target;
- D: Distance from the staring point to the target;
- W: Width of the target along axis of motion.
HCI concerns:
- the design, implementation, and evaluation of interactive computing systems for human use and,
- provides input language for the user, an output language for the machine, and a protocol for interaction
2 Human Information Processing
2.1 Problem Solving
goal: emotion (motivate)
emotion: achieving goal / avoiding
- Problem Solving: strategies, means, and procedures to achieve a goal;
- Problem: How to get what I want? Ask problem from stakeholders;
- Goal State: The desired end state or solution of the problem solving activity;
- Not good to have more and more desired area while improving, no ends
- Sub Goal: Middle-term goal along the way to solving a problem;
- Problem Space: Short, middle, and long term goal states and the information needed at each step;
2.2 Problem Continuum
Well-defined problem:
- Full specification of the provided data, actions, strategies, and goal states, which can be represented in a problem space;
Ill-defined problem:
- Partial or imprecise specification of the provided data, actions, strategies, and goal states, which cannot be (entirely) represented in a problem space
Goal Decomposition:
- Breaking down a complex problem into smaller ones by determining sub goals;
- Goal state: mission
- Sub goal: business goals
- Sub sub goal: targets
- Not just simple sum up sub goals to the mission, need to be connected
2.3 Problem Solving Strategies
- Difference Reduction:
- To achieve each sub goal by bringing the current problem state closer to the goal state;
- Means-end Analysis:
- For each sub goal, a different procedure decreases the difference between current problem state and goal state even if this temporarily leads away from the goal state;
- Best one may NOT be the closest one;
- Go to the indirectly related goal first,
Forward and Backward Reasoning:
- Recursive inference principles. Used to solve well-defined problems, which explicitly have formal limitations (chess, maths)
Logic Reasoning:
- Only allowed for known problems
- Must have 1 to 1 relationship
- Forward reasoning: If cause, then effect (symptom): fire $\to$ smoke;
- Backward reasoning: If effect (symptom), then cause: smoke $\to$ fire;
- Where many have many causes, may be wrong, so be careful of the assumption;
Analogical Reasoning:
- relations between features and categories that are similar (is like) to relations between other features and categories
- “The clock signal is the heartbeat of your computer“
- One type: Case-based reasoning:
- Old solution : old problem :: adapted solution : new problem
- The Similar(old) problem may have nothing to do with the specific problem. like the things you do not like/hate, for no relation with you do not care;
Random trial-and-error:
- A low level problem solving strategy but commonly found with non-expert users;
- e.g. fair die;
- To play/get the goal;
- Creative Problem Solving:
- Give a different function to the (standard) means that are available to solving the problem;
- The fusion of two worlds;
- Going beyond the obvious;
- Example: Creativity and Deep Learning (DL)
- DL has NO constant knowledge leads to pure association/like/similar/ which creativity but may be wrong;
2.4 Problem Representation
How you represent a problem (e.g., text or image) affects its solution;
- Surface level
- Structural level
- Symbolic level
Details leads to rational problem solving;
Global leads to associative problem solving;
Decisions:
Structured decisions: usually relate to well-defined problems and a more precise problem state;
Unstructured decisions: usually relate to ill-defined problems and a more vague problem state;
3 Visual Perception and Computer Graphics
3.1 Visual System
Eyes:
- Images are focused upside-down on retina
- Pattern comes first e.g. how big/large for animals
- Brightness:
- only wave length on the reality,
- brightness only for human
- Pattern filters:
- filters pass middle frequencies better than higher and lower frequencies: evolution not under the sun, not in the night
- contrast difference -> more clear;
- reality != reality in human brain;
- Human eye may be tired of some colors, wear out;
- Mutual suppression
Perception:
- Color:
- Color is NO property of the physics of light
- Color is the human interpretation of different energetic frequencies;
3D:
- based on human’s eyes’ moving constantly and interpretation;
- 3D vision is NO property of image on the retina (which is 2D);
- Sizes on the retina are not actual sizes;
- Flipped, rotated, and resized;
- Law of size constancy:
- familiar objects are perceived as constant size in spite of changes in visual angle;
Optic flow:
- brain’s cue to calculate position in space;
- Expanding optic flow makes the body lean forward;
- Contracting optic flow makes the body lean backward;
Movement:
- Long retinal path indicates close by;
- Short retinal path indicates far away
- The object closest to the eye ‘moves’ the most because the retinal path is longer;
- Short path is behind long path; therefore, there must be depth
Motion parallax:
- Side of leaving visual half field indicates motion direction:
- Same side of your direction means object goes with me;
- Opposite side of your direction means object stays behind;
- Side of leaving visual half field indicates motion direction:
3.2 Pattern Recognition
- Pattern recognition is NO property of the data.
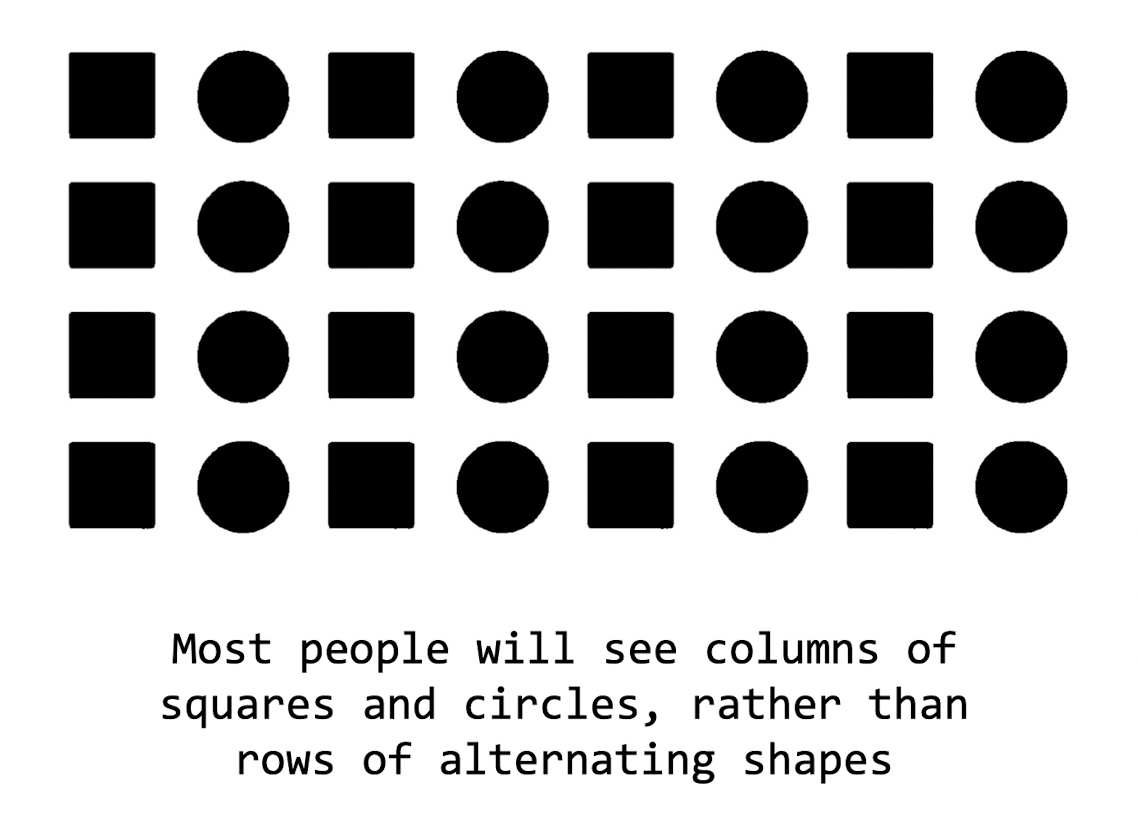
3.2.1 Similarity
Items that are Similar tend to be grouped together;
- Humans tend to recognize patterns even where they are not
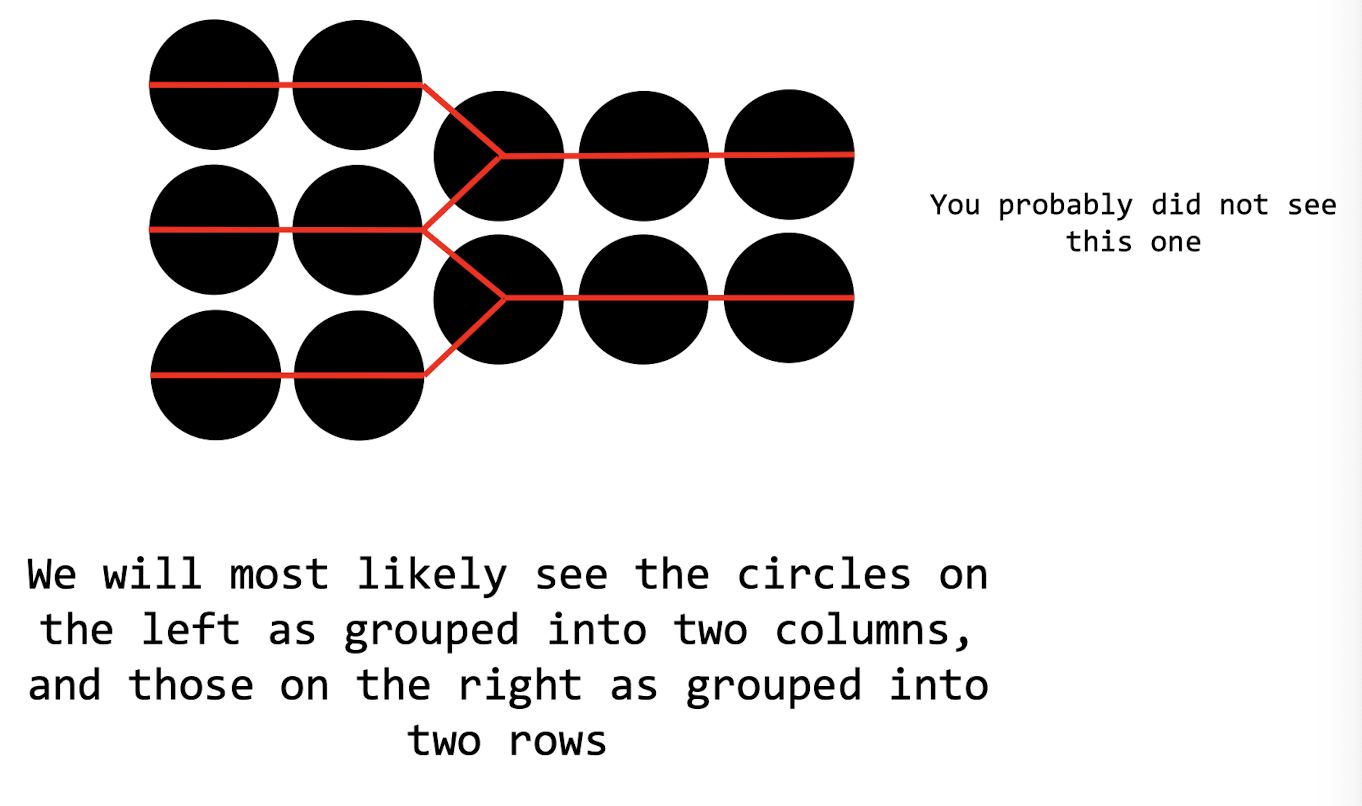
3.2.2 Proximity
Objects Near each other tend to be grouped together;
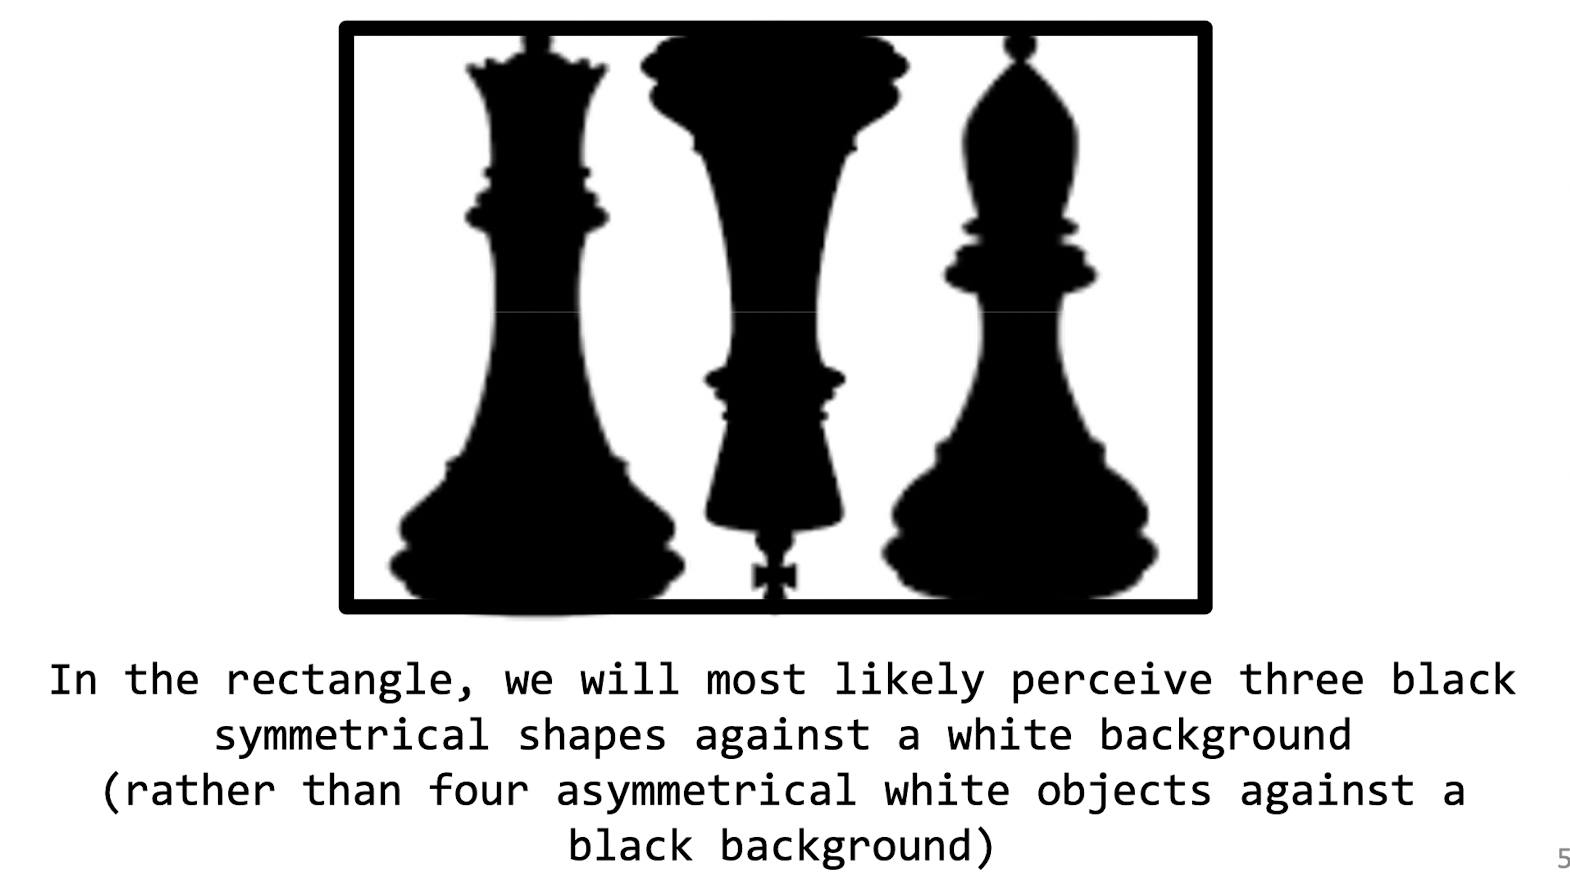
3.2.3 Symmetry
Symmetrical images are perceived Collectively, in spite of distance
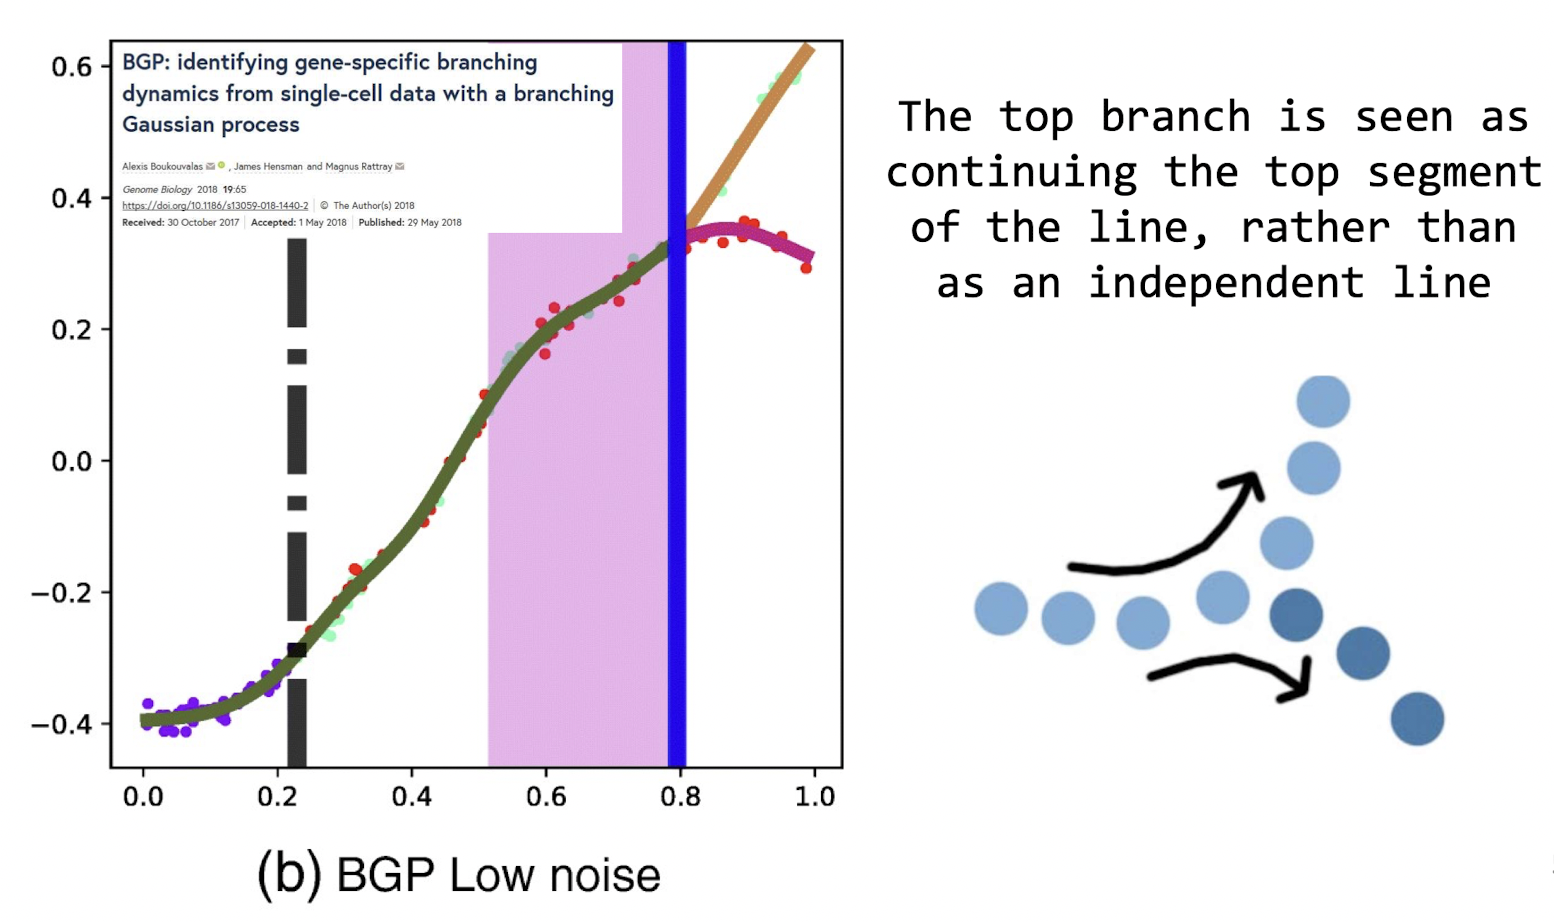
3.2.4 Continuity
Lines are seen as following the Smoothest path
3.2.5 Closure
Objects grouped together are seen as a Whole. We tend to Ignore Gaps and Complete lines
3.2.6 Smallness
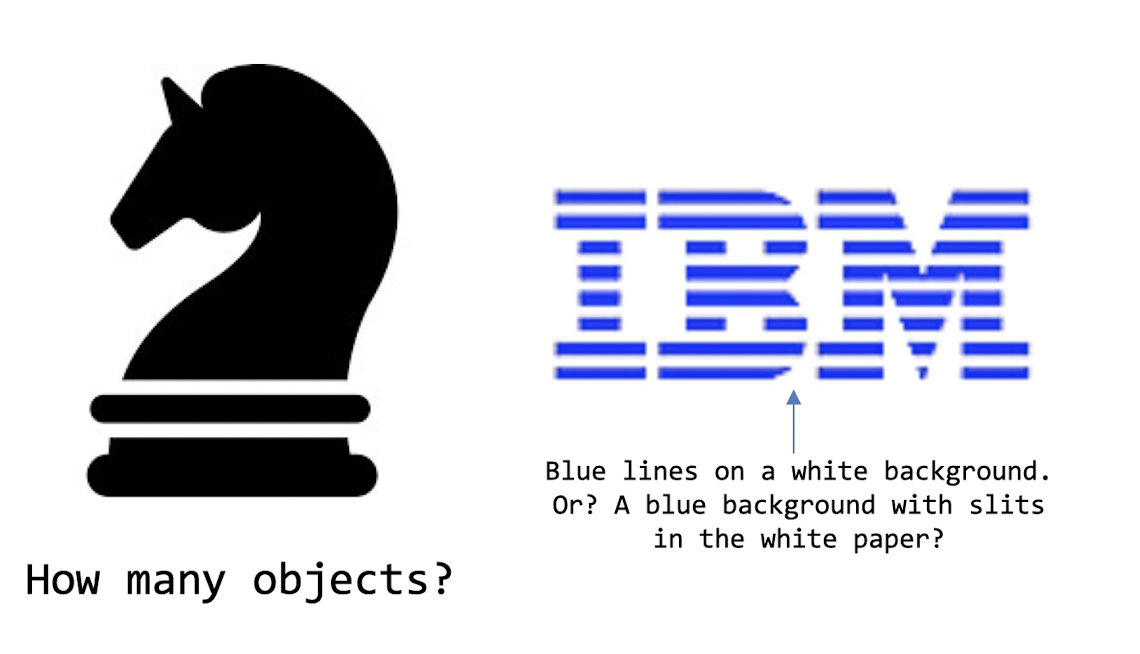
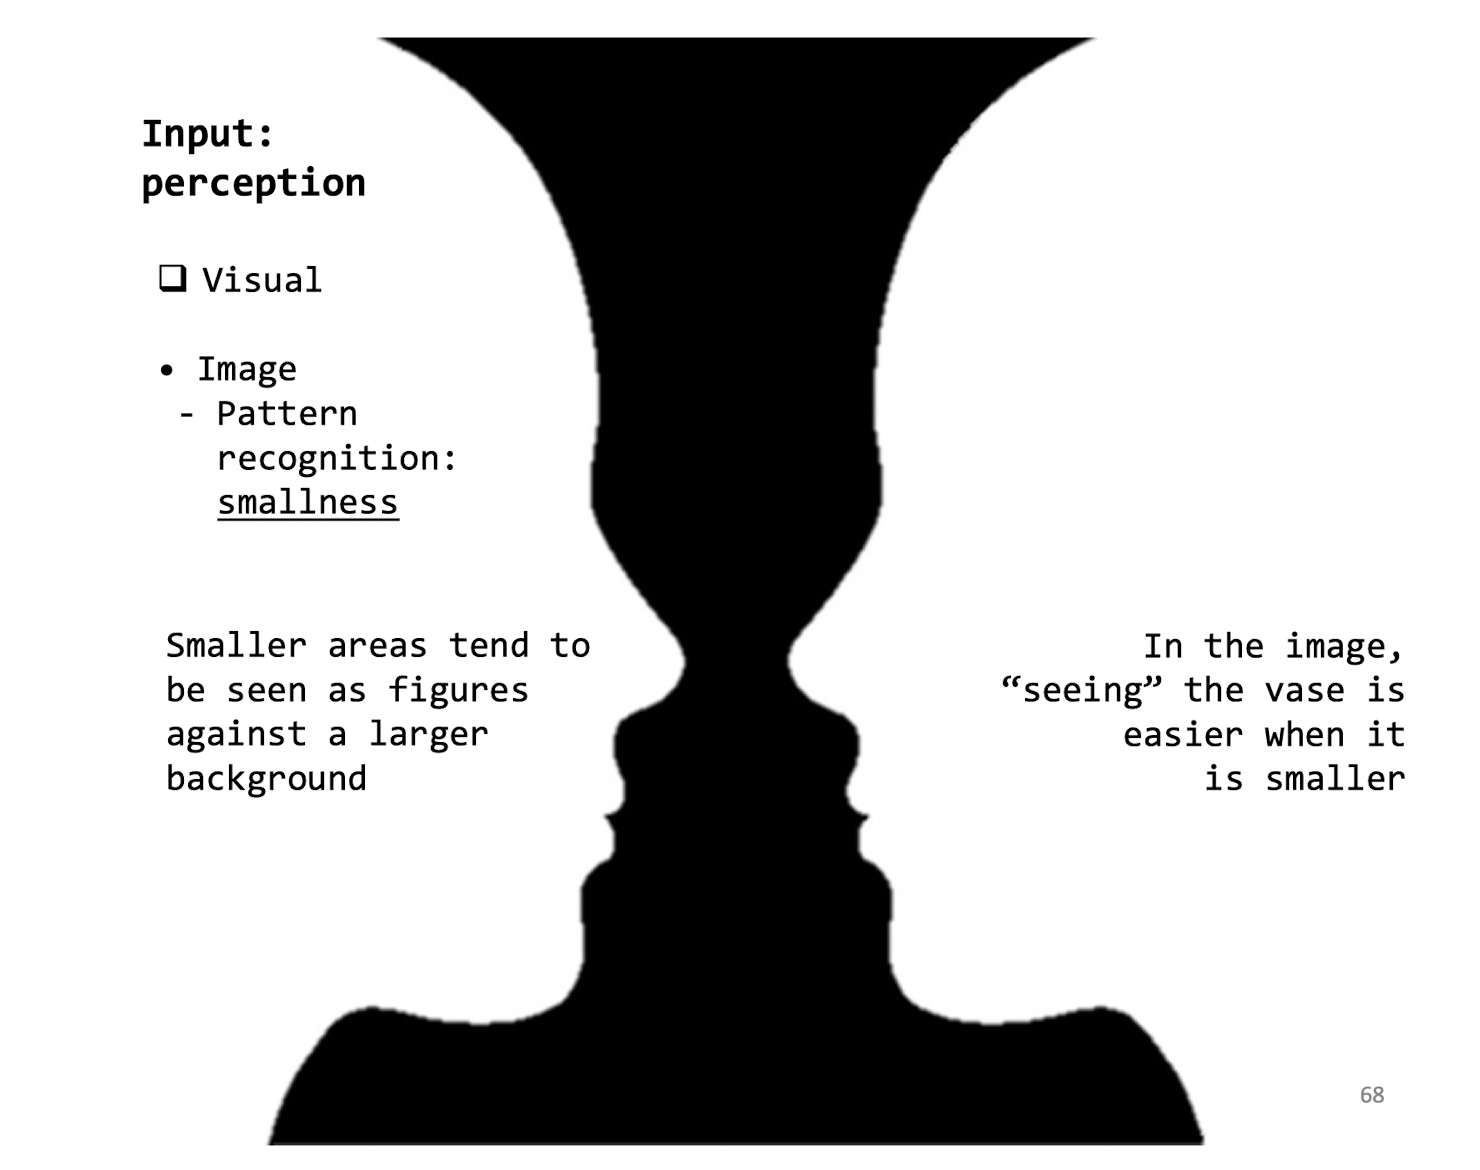
Smaller areas tend to be seen as figures against a larger background
3.2.7 Surroundedness
Areas which are surrounded by others tend to be seen as independent figures


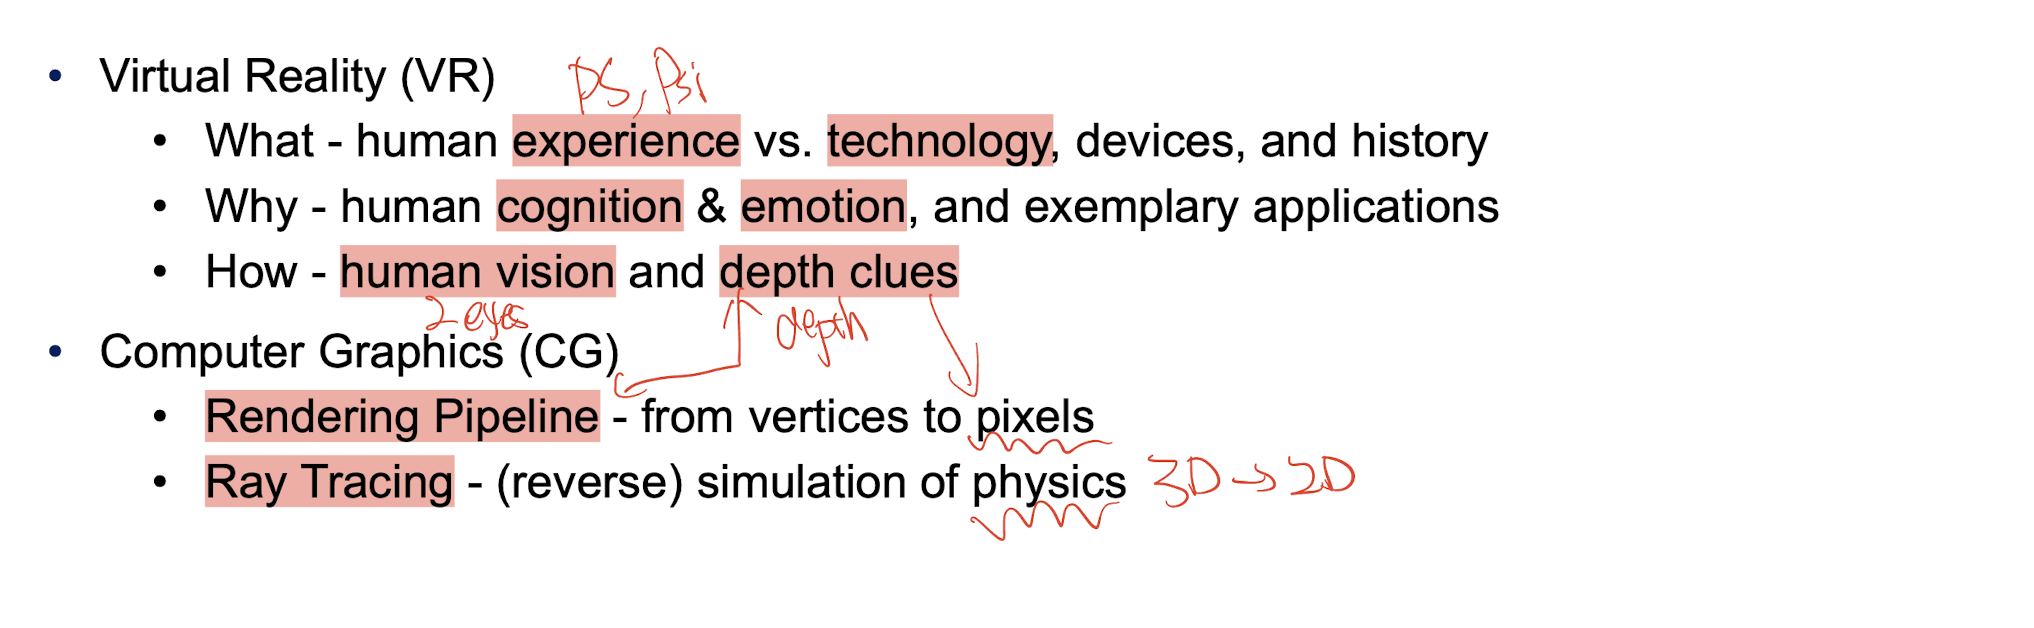
3.3 VR
The key to defining virtual reality in terms of human experience rather than technological hardware is the concept of presence.
Uncanny Valley Effect
- A person’s response to a humanlike robot would abruptly shift from empathy to revulsion as it approached, but failed to attain, a lifelike appearance.
Place Illusion (PI)
- “being there”
- “presence”
- “tele-presence”
- The illusion of being in a place in spite of the sure knowledge that you are not there.
Plausibility Illusion (Psi)
- The illusion that what is apparently happening is really happening (even though you know for sure that it is not).
- Three Necessary Conditions of Psi
- Events occur in relation to you personally (you are the subject of an action)
- Pushing back;
- The virtual world responds to you
- boom, explosion;
- Overall credibility (in the context)
- Story;
- Events occur in relation to you personally (you are the subject of an action)
Four technologies are crucial for VR:
- the visual (and aural and haptic) displays that immerse the user in the virtual world and that block out contradictory sensory impressions from the real world;
- the graphics rendering system that generates, at 20 to 30 frames per second, the ever-changing images;
- the tracking system that continually reports the position and orientation of the user’s head and limbs;
- the database construction and maintenance system for building and maintaining detailed and realistic models of the virtual world.
Four auxiliary technologies for VR:
- synthesized sound, displayed to the ears, including directional sound and simulated sound fields;
- display of synthesized forces and other haptic sensations to the kinesthetic senses;
- devices, such as tracked gloves with push buttons, by which the user specifies interactions with virtual objects;
- interaction techniques that substitute for the real interactions possible with the physical world.
Depth Clues
- Binocular disparity (two eyes)
- this is the difference in the images projected onto the back the eye (and then onto the visual cortex) because the eyes are separated horizontally by the interocular distance.
- Human has a roughly 120-degree binocular vision
- Accommodation
- this is the muscle tension needed to change the focal length of the eye lens in order to focus at a particular depth.
- Convergence
- this is the muscle tension required to rotate each eye so that it is facing the focal point.
- Perspective
- objects get smaller the further away they are, and parallel line converge in distance.
- Sizes of known objects
- we expect certain object to be smaller than others. If an elephant and a mug appear the same size, then we expect the elephant to be further away.
- Detail
- close objects appear in more detail, distant objects less.
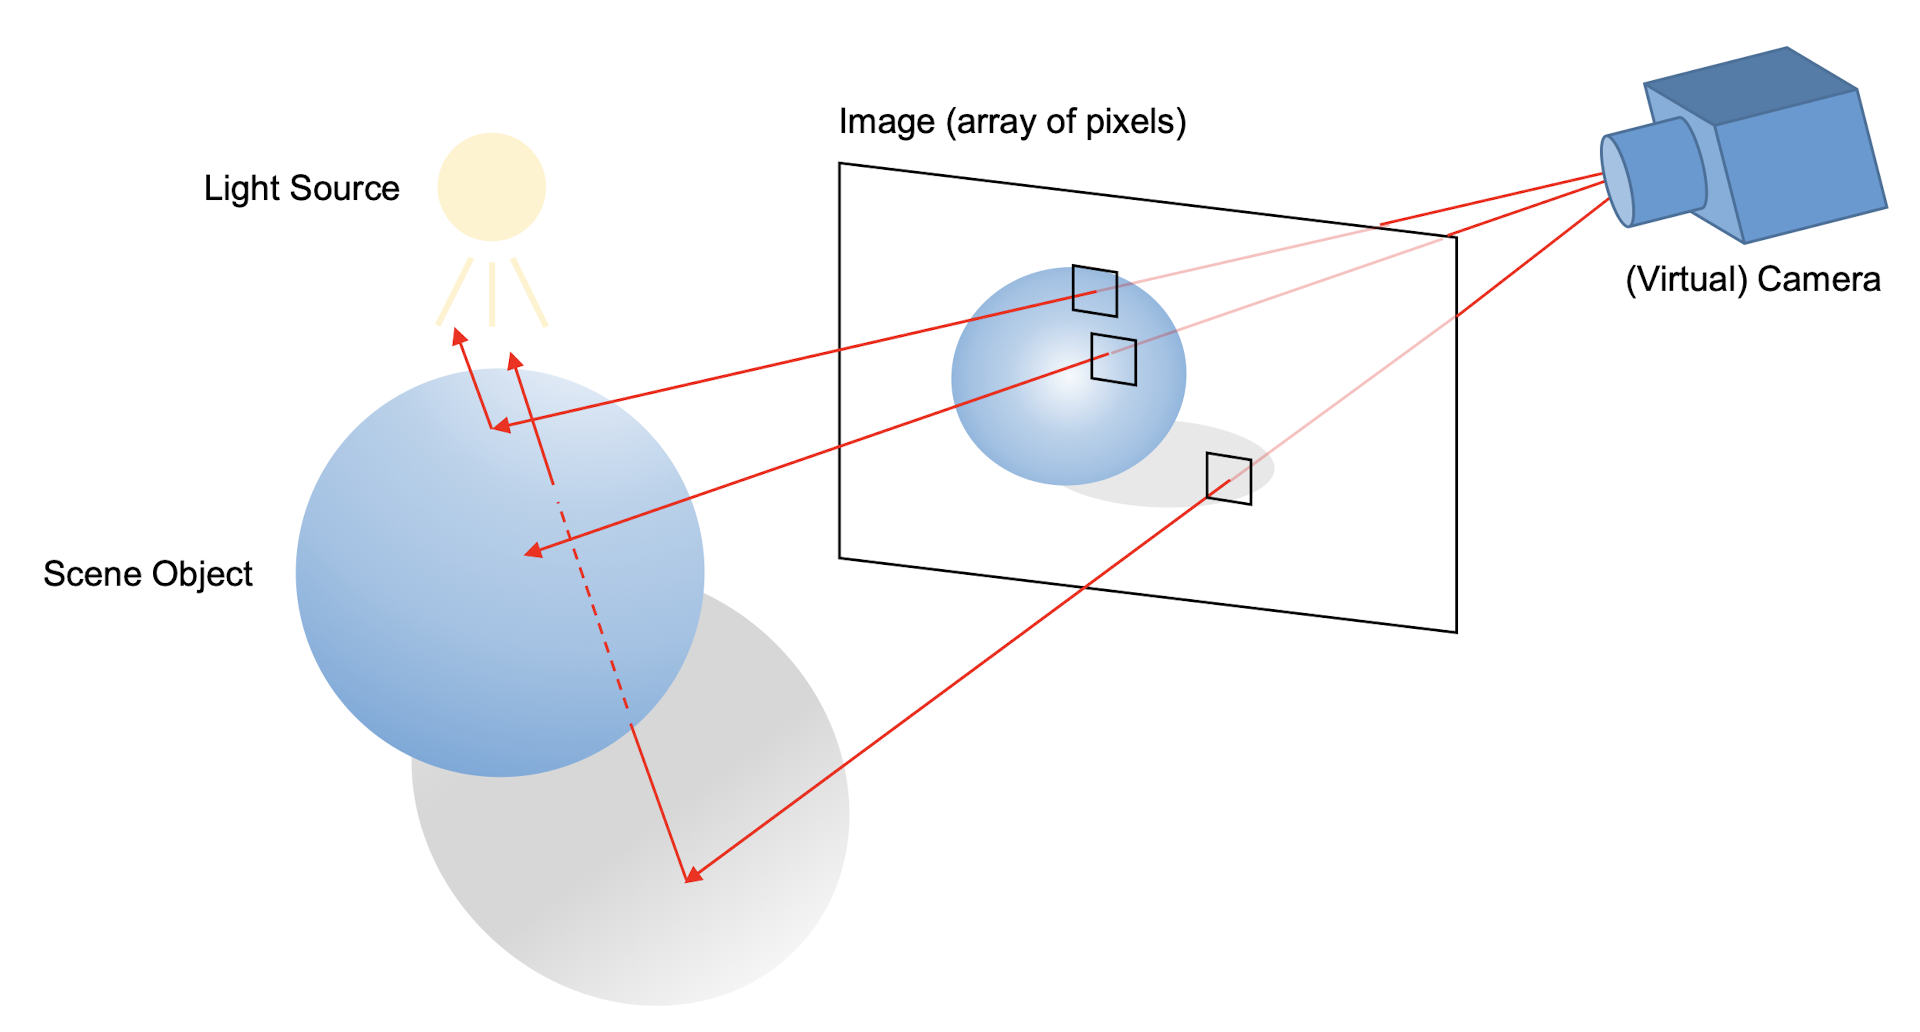
- Occlusion
- an object that blocks another is assumed to be in the foreground.
- Light & shadows
- if the light source is directional, we expect objects in the foreground will project shadows on objects in the background.
- Relative motion
- objects further away seem to move more slowly than objects in the foreground.
3.4 Computer Graphics
Rendering Pipeline (RP)
3.4.1 General (rasterization) RP
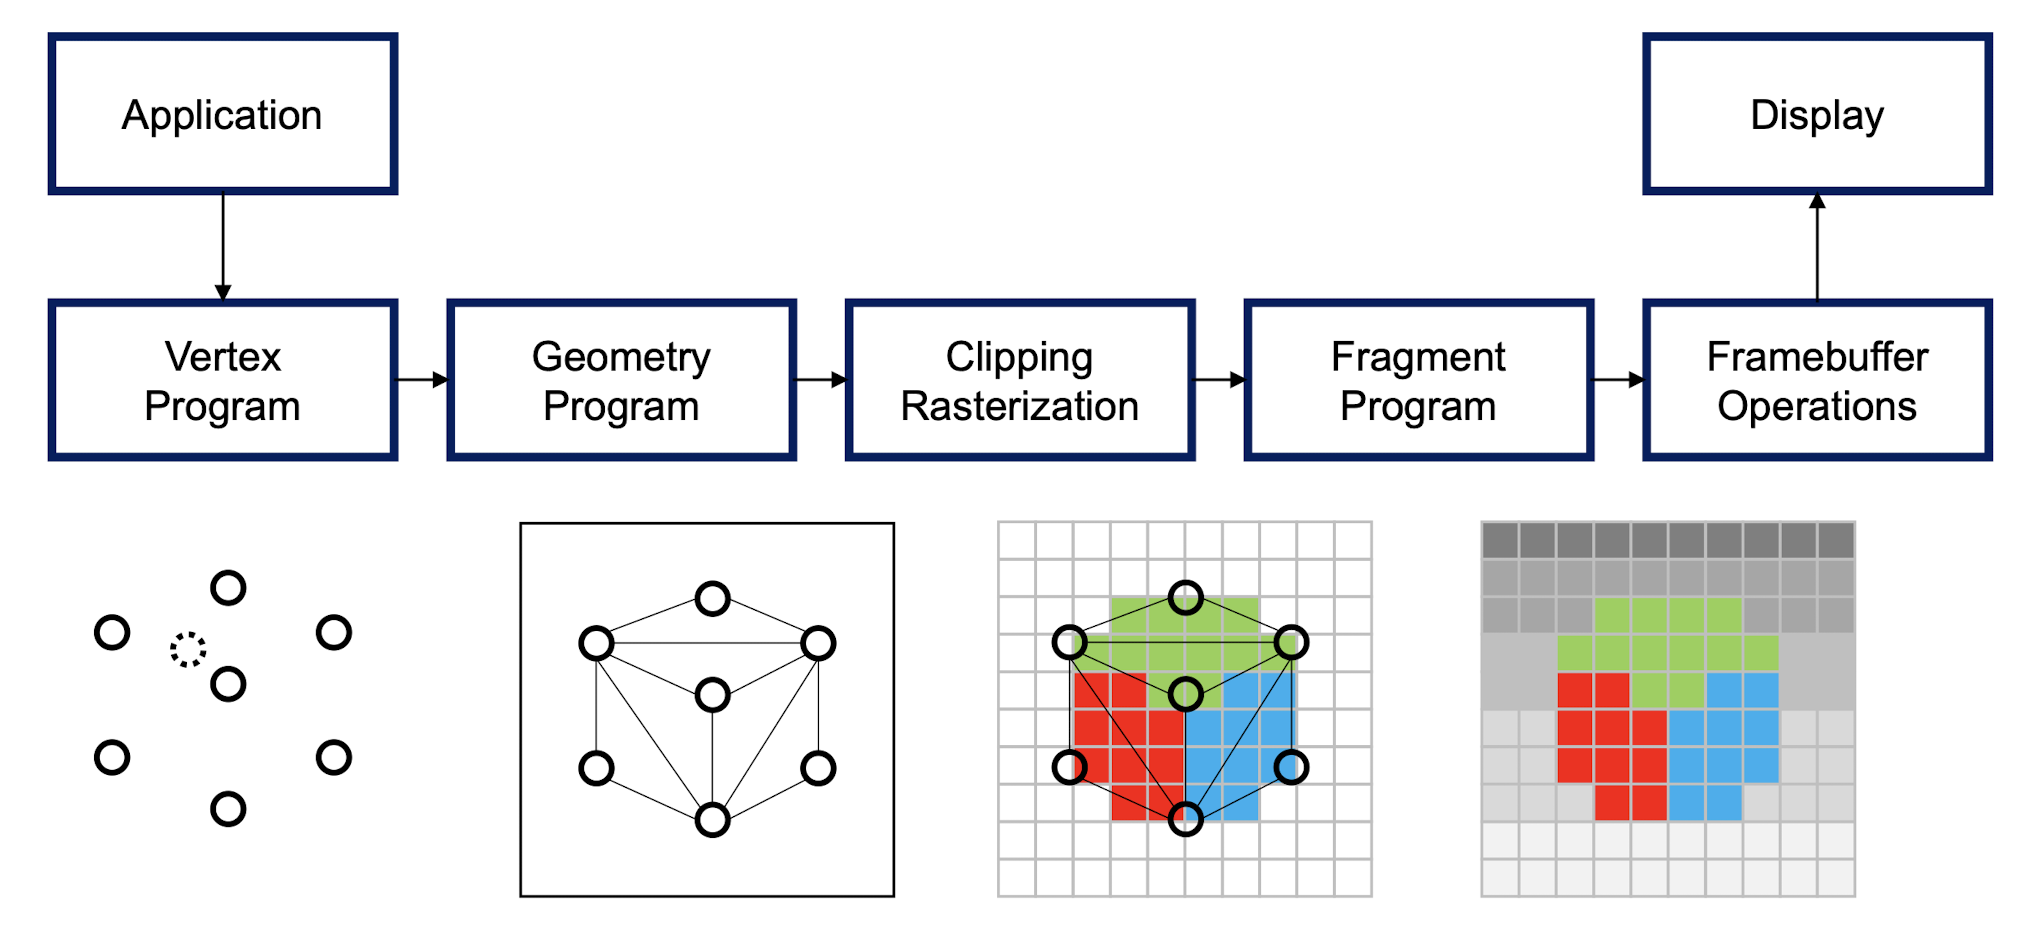
- Rasterization RP is well optimized (i.e., it is very FAST)
- Model rasterization RP supports more realistic lighting
- Lightmaps
- Light Probes
- Real-time global illumination
3.4.2 Ray Tracing
- RT simulates real physics of light (i.e., it is very costly)
- NVIDIA Deep Learning Super Sampling (DLSS)
- RT denoising is again very costly
3.5 Recap
4 Language & Communication & Dialogue
Solutions of Interface Hall of Shame (Problems):
- Present adequate and comprehensible information;
- Provide “real” choices (for solving the problem)
- Avoid ambiguity or self-contradictory
- Save users’ time and efforts
4.1 Coding Language
Talk to the machine: Coding language
- Unlike the ordinary machine, Computer can be approached through language (like language the machine can understand)
Programming language:
- Low-level: machine code, Assembly, etc;
- High-level: Java, Python, Ruby, etc;
- Translate language X to Y (Compilers);
- Program to Program, high to low;
- Graph into program (Figma to code);
- Program/specification to hardware.
701 machine:
- assembly languages;
- Software costs exceed that of hardware.
FORTRAN:
- 1954-7 marks the FORTRAN I project
- translate high-level language to assembly language;
- Development time cut from weeks(701) to hours(FORTRAN);
- beginning of the high-level language;
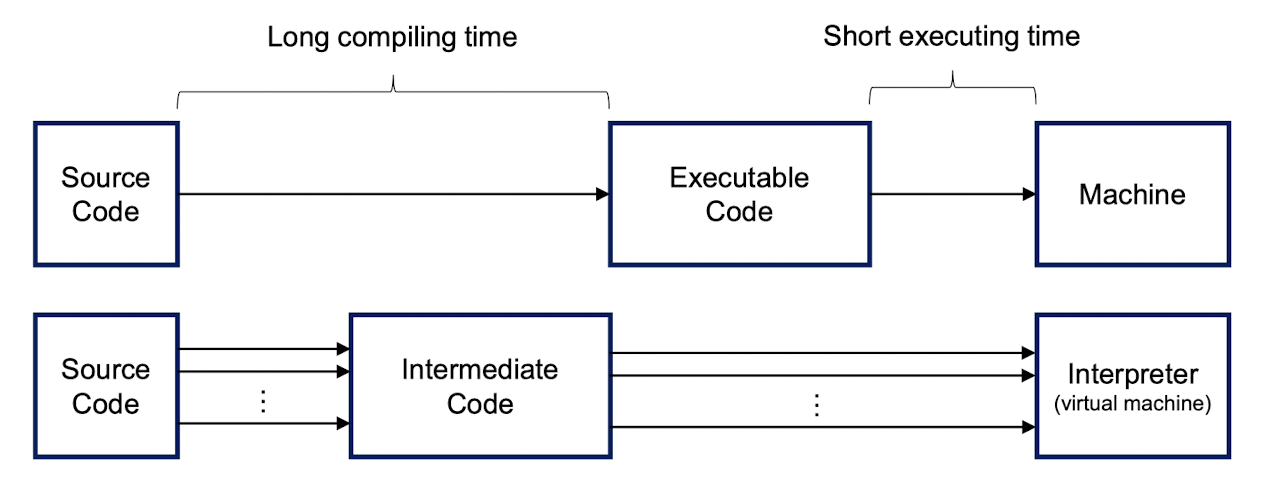
Interpreter and Complier:
Interpreter(Ahead of time): translates just one statement of the programme at a time
- Cross-platform(PRO): can run same exe(class, intermediate code) in different machines (Interpreter will do the adoption);
- Compiling time(PRO): short
- Execution efficiency(CON): low
Complier(just in time): translate the entire programme into machine code at once;
- Cross-platform(CON): can NOT run same exe in different machines;
- Compiling time(CON): long
- Execution efficiency(PRO): high
Java: bending two types;
Complier | Interpreter:
4.1.1 Compiler Architecture
Two phases:
Analysis phase:
- Breaks source program into pieces to intermediate code;
- Lexical Analysis
- Syntax Analysis
- Semantic Analysis
- Breaks source program into pieces to intermediate code;
Synthesis phase:
- Generates target program from intermediate code;
- Intermediate Code Generator
- Code Optimizer
- Code Generator
- Generates target program from intermediate code;
1. Line Handler:
- handle input/output
- Input line treated as array of characters, uses pointer to next character;
- Skips over whitespace, ignores comments, handles continuation lines
2. Lexical Analyzer:
- scans the outputs from line handler from left to right;
- Convert into tokens:
- Token: categorized sequence of characters;
- identifier, reserved word, number, operator
- e.g. int, def, 123, +, -, *, /, etc;
position, initial, rate, 60;scanning;
- Including Attributes:
- Type of the identifier
- Storage allocated for the identifier
- Scope of the identifier
- Number and types of arguments (for function identifiers)
3. Syntax Analyzer
- parsing;
- groups of related tokens;
- parse tree: hierarchical structured representation;
- Hierarchical structure expressed by recursive rules (tree recursion traversal)
position = initial + rate * 60;grouping;
- syntactic error checking;
4. Semantic Analysis
- meaning of the program
- Checks for semantic errors, such as type errors
position = initial + rate * 60;understanding;
5. Intermediate Code Generation
- a program for an “abstract machine”;
- to be easy to translate into the target program(simply)
- convert into general form, explicit and clear steps
position = initial + rate * 60; into general form:temp1 = float(60);temp2 = identifier3 * temp1;temp3 = identifier2 + temp2;identifier1 = temp3;
6. Code Optimizer
- Improves to code runs faster or save space;
- Methods:
- Constant folding - perform operations on constants at compile time 2 * 3.14 → 6.28
- Reduction in strength: x^2 → x * x
- Loop unrolling: for (i = 1; i <= 3; i++) { x[i] = y[i]; } → x[1] = y[1]; x[2] = y[2]; x[3] = y[3];
position = initial + rate * 60; into general form:temp1 = float(60);temp2 = identifier3 * temp1;temp3 = identifier2 + temp2;identifier1 = temp3;- optimize:
temp1 = identifier3 * 60.0;identifier1 = identifier2 + temp1;
7. Code Generator
- Generates target code consisting of Assembly code
- Steps:
- memory locations for each variable;
- translate into assembly instructions;
- Write into memory;
temp1 = identifier3 * 60.0;identifier1 = identifier2 + temp1;
generate:
1 | |
4.1.2 Drawbacks
- to be the only interface that a computer had;
- DOS: Disk Operating System;
- bad interface;
4.2 Dialogue Language
Example:
- System presents an output observed by the user who performs a task
- User articulates an input that makes the system perform
4.2.1 Dialogue Design
dialog is a conversation between two or more parties, usually cooperative
In UI:
- logic/structure of the interaction;
- syntactic level of human-computer ‘conversation’;
Levels:
- Lexical - shape of icons, actual keys pressed, characters
- Red for error; Yellow for warning; Green for success;
- Syntactic - order of inputs and outputs (keystrokes, clicks)
- Semantic - effect on internal application/data, meaning of keystrokes, clicks
Reason:
- Analyze systems
- Separate lexical from semantic aspects
- understand proposed designs;
- For discussion:
- Turn into code;
- For system testing;
- gain productivity;
- Save time by formalizing the design;
Methods:
To describe dialogues:
- State Transition Networks (STN)
- State diagrams (UML)
- Flow charts
- Petri nets
- JSD diagrams (Jackson Structured Design Diagrams)
- Formal Grammars
- Production Rules
1. State Transition Networks (STN)
- Circles: States
- Arcs: Actions/Events
- Rectangles: sub-STN (Hierarchical)
1.1 Concurrent Dialogues
- Several things happen simultaneously
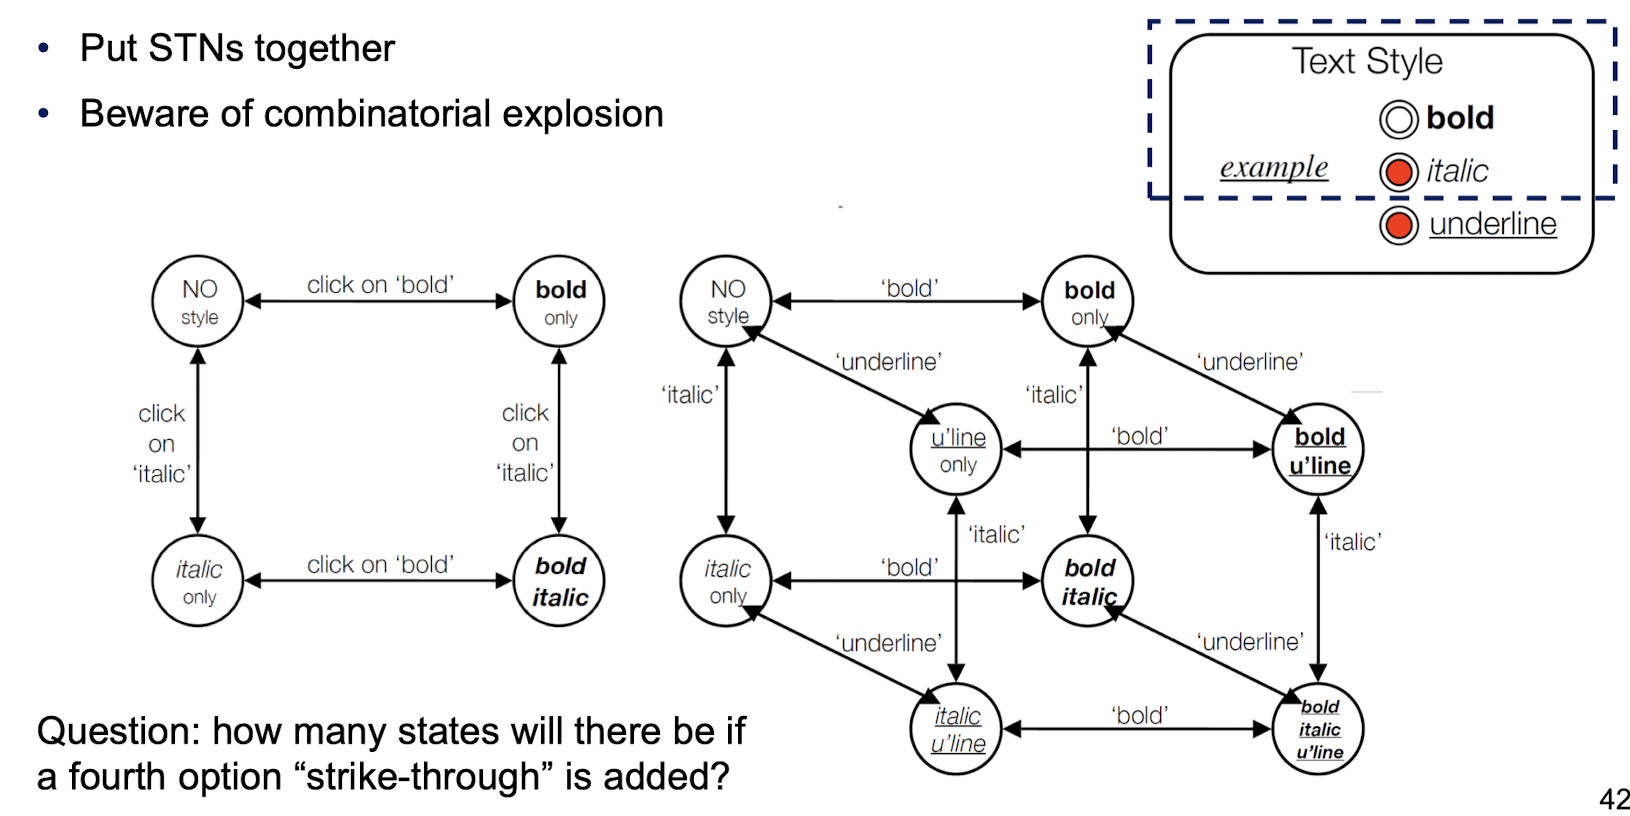
- Several things happen simultaneously
2.2 Design of Escapes
‘back’ in Web, Escape/cancel keys
- Use hierarchical menus: ‘normal’ exit for each submenu plus
- separate escape arc active ‘everywhere’ in submenu
2.3 Design of Help Menus
- Menu structure nearly the same everywhere
- Usually best added at a ‘meta’ level
2.4 Dangerous States
- Two-mode word processor
4.2.2 Graphical User Interface
- GUI: “gooey;”
- A form of user interface that allows users to interact with “computers” through the manipulation of graphical and textual elements (often accompanied by auditory notations)
Concepts:
- 1.Information processing model;
- 2.Mismatch between user and system models
- The gulf of execution
- The mismatch between the user’s intentions and the allowed actions
- The gulf of evaluation
- The difference between the user’s expectations and the system’s representation
- The gulf of execution
- 3.Response time
- time for the system to process the input and present the output
- Large time cause:
- User frustration;
- Error input;
- Less efficient (objective of introducing GUI);
- 4.Control and automation
4.3 Natural Language Processing
4.3.1 Talk to Machine
Code: programming language
4.3.2 Talk to Machine with Natural Language
Fear or Like
Next point: Mastering the language;
Need to understand human first.
4.3.3 NLP
Semantic Analysis.
- Abstract;
- minimal;
- Computer has less conceptual knowledge;
Syntactic Analysis.
Part-of-speech tagging.
- in classes
- Bayes classifier
Tokenization
- Western language based on sound;
- Chinese is based on character;
Speech Recognition
- Noise filtering;
- Method:
Difficulties in NLP:
- Error Cascading
- Ambiguity
4.3.4 Natural language understanding & generation
- Identity world
- Reference
- Perspective
- Ambiguity
- Sense
- Reference
- Variation
- Vagueness
- Within real world contexts for real world problems
Variation
Joker: xxx, xxx, xxx for same one person
Person: withholder, scandalmonger
Ambiguity
One word has many meanings
5 Ergonomics & IO Devices
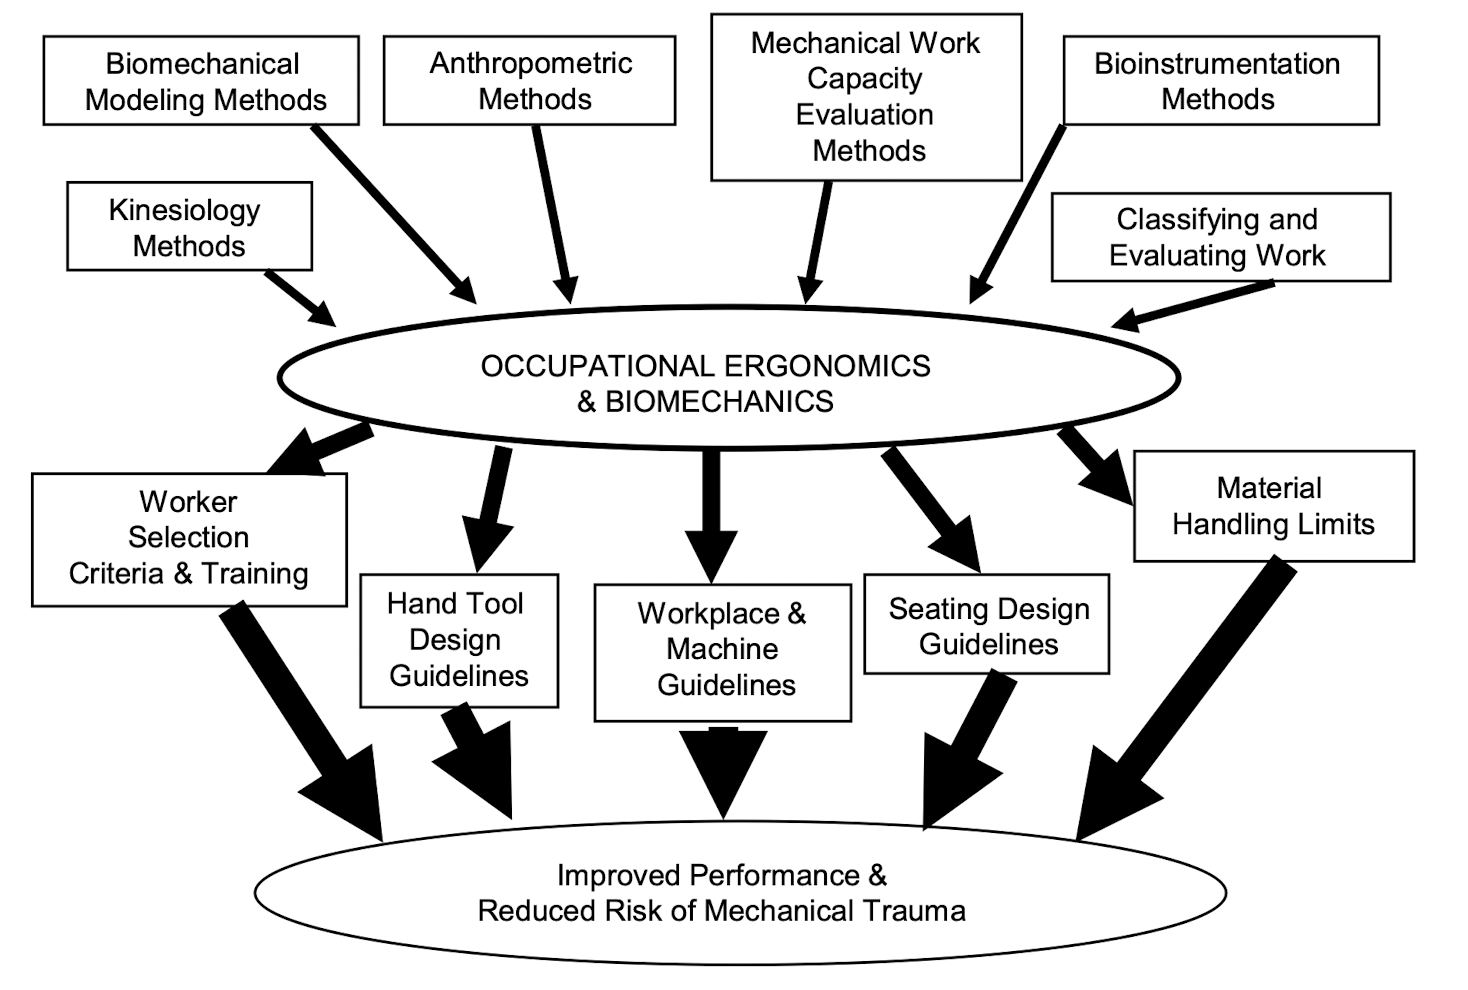
5.1 Ergonomics
Ergonomics (or human factors)
- is the scientific discipline concerned with the understanding of the interactions among human and other elements of a system, and the profession that applies theory, principles, data and methods to design in order to optimize human well-being and overall system performance.
5.1.1 Physical
Physical Ergonomics
- is concerned with human anatomy, anthropometry, physiology and bio mechanical characteristics as they relate to physical activity in work or daily life.
5.1.2 Cognitive
- How do users expect the technology to work?
- How is information displayed?
- How well are stereotypical expectations met?
- How complex is the interface?
- How much training is required? (e.g., Boeing 737 MAX MCAS see next slide)
- What user knowledge assumptions are met?
- How does information facilitate learning and memory?
5.2 Input
Mouse:
Pros:
- works in small spaces (trackballs are better?)
- can adjust granularity of movement
- inexpensive
- user can keep eye on display
- direct relationship between hand and cursor movement on the dimensions of direction, distance, and speed
- diagonal and continuous movement, spaced control
Cons:
- hand must be removed from the keyboard
- require space beside keyboard movements
- relative mode only
- mechanical mice pick up dust and other debris / optical mice might not work on certain surfaces (e.g., glass)
- require a certain amount of learned eye-hand coordination (awkward and difficult for first-time users)
Touch interface
the good:
- direct manipulation (i.e., direct eye-hand coordination)
- several technologies to choose from, including pressure-sensitive, resistive, infrared, capacitive
- faster and easier to learn than other input devices (kids can use!)
- no command memorization needed
- user may be led through correct command sequence
- good for infrequent use
- minimal training needed, high user acceptance
- continuous motion in all directions
- no extra desk space
- no moving parts
the bad
- very fast, not very accurate
- “fat” fingers (Lecture 1)
- limited resolution
- difficult to select small targets
- very slow text and data entry
- finger/arm may obscure screen
- overlays may lead to motion parallax (Lecture 03)
- inadvertent activation
- screen can get dirty (oil from fingers)
- susceptible to temperature and humidity
- arm fatigue for conventional computer monitors
- should be limited to low-frequency usage
Speech recognition (NLP)
Conversion of spoken language to commands or data
Advantages over other input methods:
- more natural form of communication, so less training required
- does not require the use of hands or other limbs, so user can carry out multiple other actions
- opportunities for physically disabled users
Problems:
- limitations of speech recognition systems (i.e., error prone)
- susceptible to environmental noise
- impractical in situations where quiet is required
- natural language capability is not yet attainable by speech recognition systems
- speech input is not suitable for all input tasks
Degree of Freedom (DoF)
- The limits to which physical movement or other physical processes are possible.
Conventional input devices:
- keyboard, pointing devices, joysticks, touch interface
Recent updates:
- eye tracking, head tracking, BCI, affective computing
5.3 Output
Visual
- Character-based displays
- liquid-crystal displays (LCDs), flat-panel displays (FPDs) • used in stationary devices, in telephones, calculators, etc.
- Graphics displays
- cathode ray tube (CRTs), LCDs, and other FPDs, 3D • hybrid reality environments (HRES) graphic displays used in stationary output devices
- Printing devices
- color vs. b/w, dot matrix, laser, inkjet • Plotters (colored pens)
- Microfiche, microfilm, videotape
- require old-school equipment to read
Haptic/Tactile
- Force feedback
- Textural feedback (vibrotactile, electrotactile, ultrasound)
- Thermal feedback
- As accessible technology
Force Feedback
- Most studied
- Very realistic in certain scenarios (e.g., training dentists)
- Commercial products are widely available (e.g., Sensable Technologies)
Textural Feedback
- Generic textural feedback is hard to achieve
- Sensory / perceptual illusions can help create realistic textural feedback - Haptic resolution and haptic perception
Sensory / perceptual illusions
Rubber hand illusion
- Body transfer illusion
- The illusion of owning either a part of a body or an entire body other than one’s own
- The sense of embodiment - three sub-components (Kilteni et al., 2012)
- the sense of self-location - a determinate volume in space where one feels to be located
- the sense of agency - the sense of having global motor control, including the subjective experience of action, control, intention, motor selection and the conscious experience of will
- the sense of body ownership
- Body transfer illusion
Haptic retargeting (use a single physical object to create the illusion of touching multiple virtual objects)
- Haptic proxy
Sound
- Tone generators
- beeps, alerting tones
- Alarms
- warning signals
- Digitized speech
- digitally recorded human speech
- Text-to-speech synthesis
- speech generated by concatenating basic speech sounds according to rules
Advanced / Futuristic I/O
- The Trend:
- Blending input and output (e.g., tablets and phones, VR headsets, wearable gadgets, etc.)
- More intuitive and natural interactions (e.g., NLP, touch interface, motion-tracked controllers, etc.)
- Multimodal interaction
- More personalized experience (potentially dangerous?)
- Robotics, BCI & Human Augmentation
6 Testing
6.1 Usability Test
Formative (during system development, usually based on a prototype)
- Understandability of application
- Completeness of application
- Quality of the application
- Ethical review (e.g., health apps)
- Liability and law (e.g., self-driving cars)
Summative (after system development)
- Process evaluation (well implemented?)
- Impact evaluation (effect on users, others)
6.2 Hypothesis
A hypothesis is a precise problem statement about your system
- States the expected statistical relationship between groups of data
- The statement has to be precise and state what we will be measuring!
[Example]
Not precise enough:
- The iPhone keyboard is better than the Blackberry keyboard
A little better:
- The iPhone keyboard is faster to type on than the Blackberry keyboard.
Most precise:
- People take less time (measured in seconds) to enter in text messages on the iPhone keyboard than on a Blackberry keyboard.
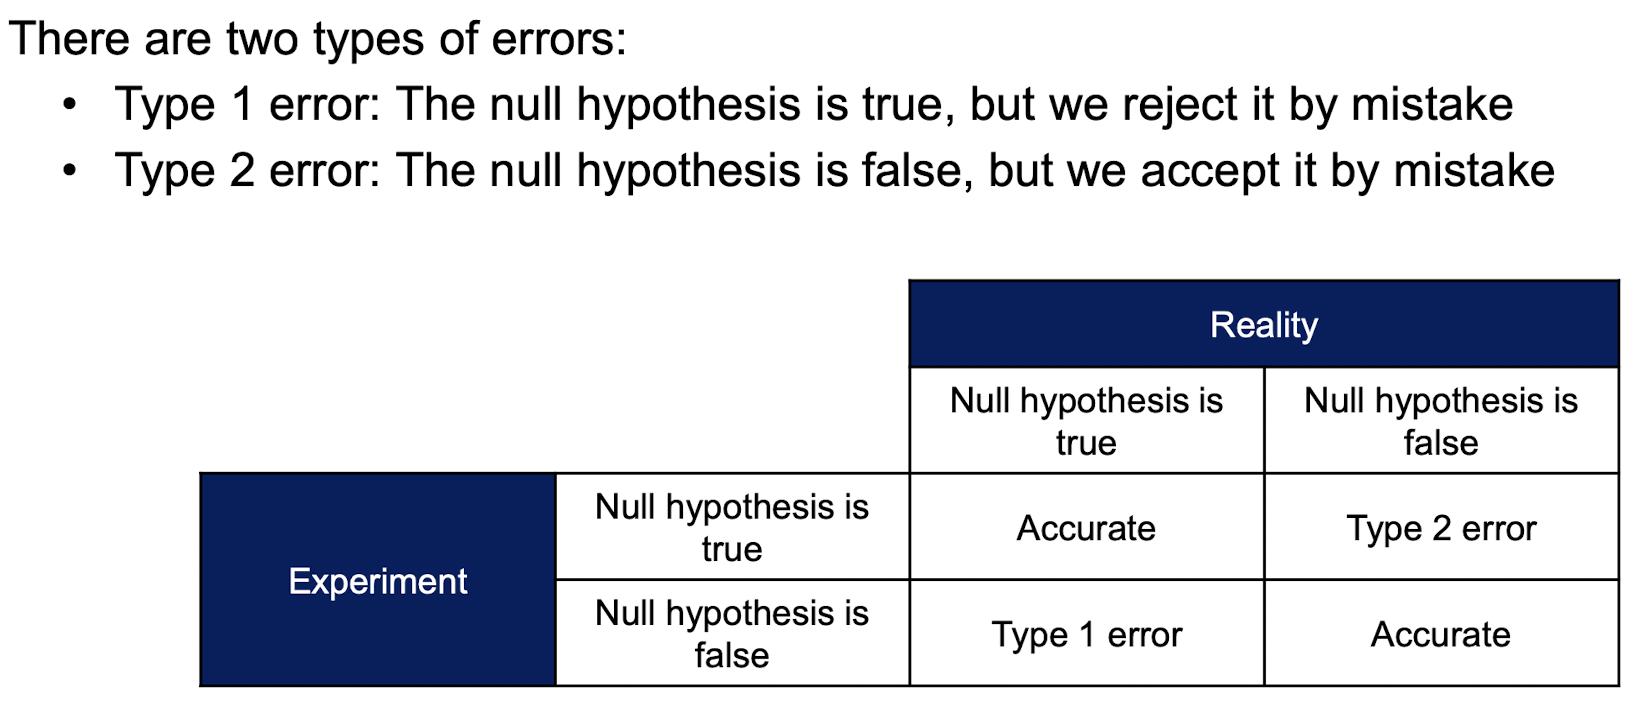
6.3 Null Hypothesis
The null hypothesis states the opposite of the expected statistical relationship conservatively
- Hypothesis:
- people take less time (measured in seconds) to enter in text messages on the iPhone keyboard than on a Blackberry keyboard.
- Null hypothesis:
- people take even or more time (measured in seconds) to enter in text messages on the iPhone keyboard than on a Blackberry keyboard.
If the observed data shows that it is significantly unlikely that this is the case, then the null hypothesis is rejected, and the alternative hypothesis is accepted.
6.4 Qualitative vs Quantitative Data
Qualitative evaluation
- Measurements are more subjective and relative (anecdotal)
- Gives us cases, data are less structured, more diverse
Quantitative evaluation
- Measurements are more precise and less subjective
- Gives us better controllable results, structured, more uniform
- More formal data, statistical analyses
- [Example]
- Time: Easy to measure, suitable for statistical analysis (e.g., learning time, task completion time, etc.)
- Error rate (frequency of errors in a certain part of a system): Shows where problems exist within a system. Suggest cause of difficulties.
- Patterns of system use (frequency of use of a certain part of the system): Study the patterns of use. Preference and avoidance of particular sections.
- Patterns of request for help (frequency of access to on-line help system): Study what users find confusing.
6.5 Dependent vs Independent Variables
Independent Variables
- Factors that are systemically varied (manipulated) by the usability researcher
- Determines a modification to the conditions that the users undergo
- e.g., interface types, practice or training given to users
Dependent Variables
- Dependent upon the user’s behavior or performance
- Properties:
- Readily observable and readily related to some scale of measurement.
- Stable and reliable so they do not vary under constant (experimental) conditions
- Sensitive to the effects of the independent variables
- [Example]
- Number of errors made,
- time taken to complete a given task,
- time taken to recover from an error,
- attitude indicated on a rating scale
- Properties:
6.6 Four Types of Variables
Nominal
- Variables that are only named (and can’t be ordered) • E.g., gender, religion, user groups, etc.
Ordinal
- Variables that can be ordered (but differences between each category is unknown)
- E.g., user preference ranking
Interval
- Distance is meaningful
- E.g., temperature in C (20C is not “twice as hot” as 10C)
Ratio
- Distance is meaningful & there is a non-arbitrary zero
- E.g., weight, length, time taken, temperature in K, etc.
6.7 Data Collection Method
Qualitative evaluation
- Observation protocols plus coding schemes (informed by theory)
- Heuristic evaluation - evaluators examining the interface and judging its compliance with recognized usability principles
- Cognitive walkthrough - evaluators work through a series of tasks and ask a set of questions from the perspective of the user
- Constructive interaction - provides natural thinking-aloud as test subjects collaborate in pairs to solve tasks (e.g., a child and an adult)
Quantitative evaluation
- Field and lab experiments
- Run a formal experiment and collect the data
- Works if there is a specific thing that we want to assess (e.g., testing a hypothesis), answering specific questions about targeted parts of a theory or system
6.7.1 Heuristic Evaluation
Nielsen-Molich heuristics state that a system should:
- Keep users informed about its status appropriately and promptly.
- Show information in ways users understand from how the real world operates, and in the users’ language.
- Offer users control and let them undo errors easily.
- Be consistent so users aren’t confused over what different words, icons, etc. mean.
- Prevent errors - a system should either avoid conditions where errors arise or warn users before they take risky actions (e.g., “Are you sure you want to do this?”).
- Have visible information, instructions, etc. to let users recognize options, actions, etc. instead of forcing them to rely on memory.
- Be flexible so experienced users find faster ways to attain goals.
- Have no clutter, containing only relevant information for current tasks.
- Provide plain-language help regarding errors and solutions.
- List concise steps in lean, searchable documentation for overcoming problems.
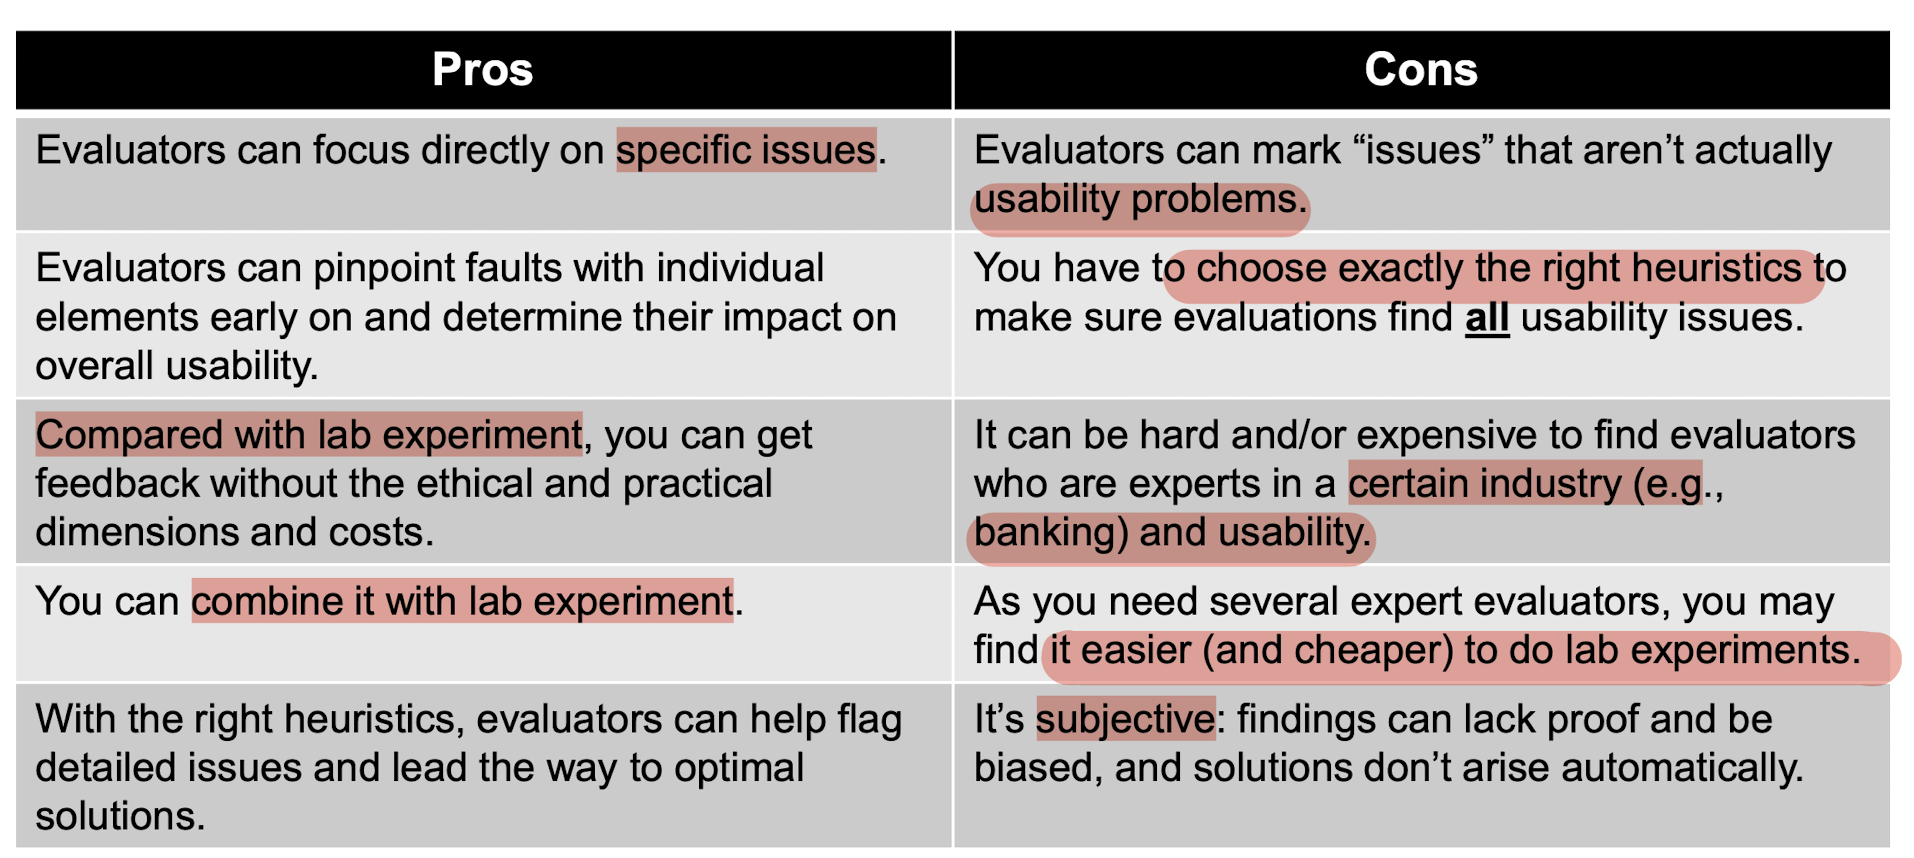
How to Conduct a Heuristic Evaluation
- Know what to test and how - Whether it’s the entire product or one procedure, clearly define the parameters of what to test and the objective.
- Know your users and have clear definitions of the target audience’s goals, contexts, etc. User personas can help evaluators see things from the users’ perspectives.
- Select 3 - 5 evaluators, ensuring their expertise in usability and the relevant industry.
- Define the heuristics (around 5 - 10) - This will depend on the nature of the system / product / design. Consider adopting / adapting the Nielsen-Molich heuristics and / or using / defining others.
- Brief evaluators on what to cover in a selection of tasks, suggesting a scale of severity codes (e.g., critical) to flag issues.
- 1st Walkthrough - Have evaluators use the product freely so they can identify elements to analyze.
- 2nd Walkthrough - Evaluators scrutinize individual elements according to the heuristics. They also examine how these fit into the overall design, clearly recording all issues encountered.
- Debrief evaluators in a session so they can collate results for analysis and suggest fixes.
6.7.2 Cognitive Walkthrough
Evaluators work through a series of tasks and ask a set of questions from the perspective of the user.
6.7.3 Constructive Interaction
Provides natural thinking-aloud as test subjects collaborate in pairs to solve tasks.
6.7.4 Lab Experiment
Definition of an experiment:
- An experiment is designed to test a hypothesis about the role of one variable (the independent variable) on another (the dependent variable)
In Confirmatory Data Analysis, or Statistical Hypothesis Testing, we have:
- A hypothesis that we wish to “confirm” or “reject”
- Two sets of measurements of the dependent variable, each corresponding to one configuration of the independent variables
- A process that we will repeat with multiple subjects
- A statistical method that we will use to compare multiple sets of data
Experimental Design
- What are the procedures to run the experiment?
Participants
- Who are going to join the experiment as participants?
Instruments
- What are the tools to be used for the benchmarking?
Data Analysis
- How are the collected data going to be analyzed?
Result Reporting
- How are the results going to be reported?
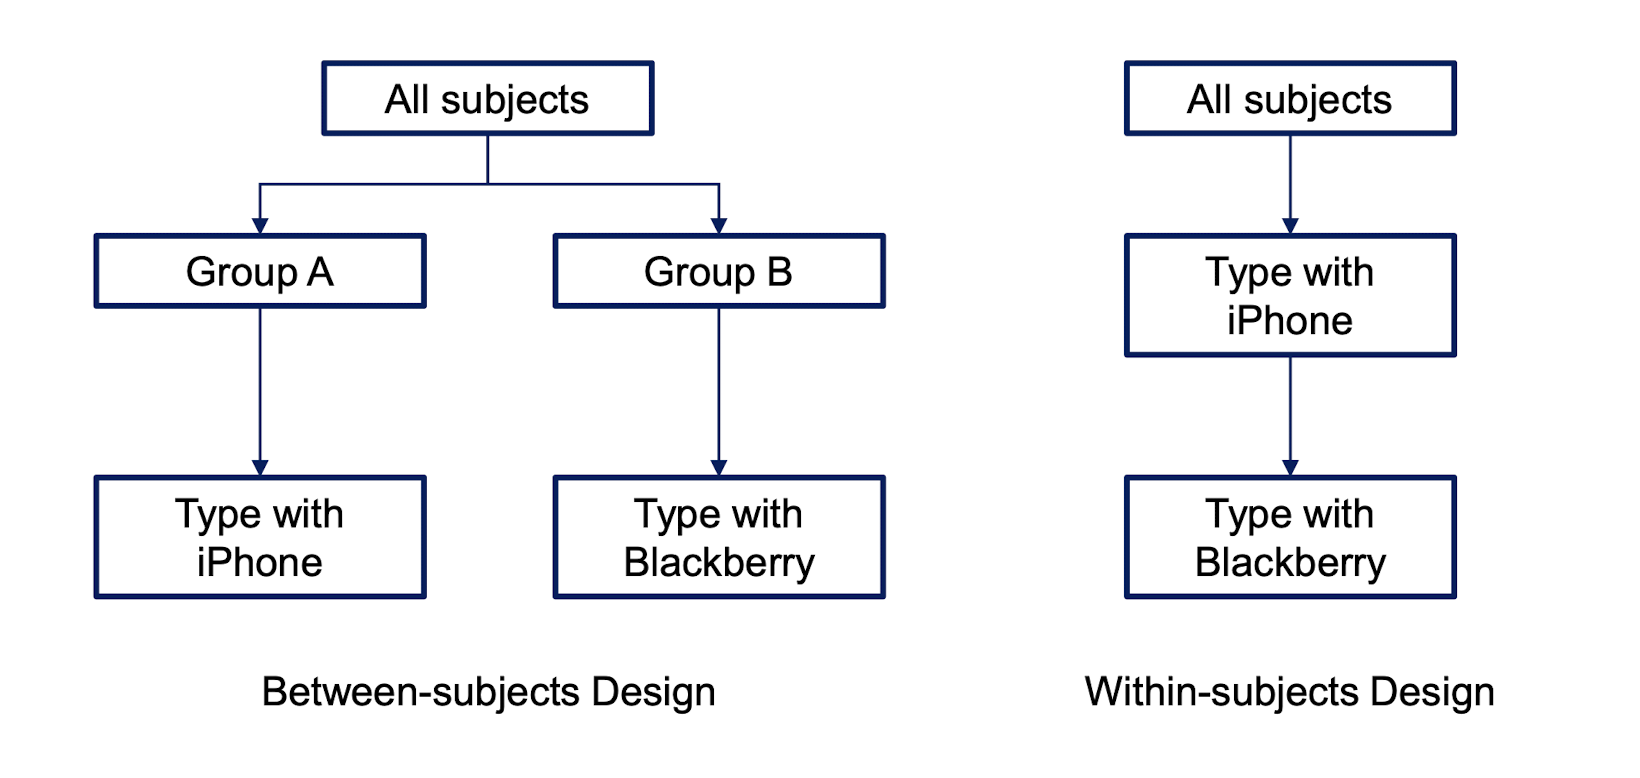
In an experiment:
- Variables that are not of interest are held constant (Controlled)
- while independent variables(IV) are manipulated
- The effects of the manipulation on the dependent variables(DV) are observed
6.7.5 Order and Confounding Effects
Confounding
- Happens when variables that were thought to be independent actually vary according to some other factor in the experiment.
- Experience factors
- People have more/less relevant experience with one condition than the other (e.g., our poorly designed on-screen keyboard study)
- People in one group have more/less experience than the other group
- Usually happens when group division is not done properly in between-subject tests (e.g., Order human subjects by GPA. Pick top half of the students, put into Group A. The other half goes into Group B)
- Experimenter/subject bias
- Experimenter subconsciously treats subjects differently, or when subjects have different motivation levels (e.g., speaking loudly to boys and softly to girls, taking as a core vs elective subject)
- Uncontrolled factors
- Time of day, system load (e.g., PolyU network is slowest between 1 to 2pm and 5 to 6 pm)
- Experience factors
- Ordering effects
- A particular type of confounding which involves the order in which the experiment tasks are carried out
- Happens with within-subject experiments
Preventing confounding and order effects
Randomization
- Control the effects of independent variable X on dependent variable Y so that effects are distributed randomly among conditions (groups)
- Does not remove effects due to unknown differences, but ensures that any effect due to unknown differences among subjects or conditions is random (and will be tackled through statistics)
Counterbalancing
- Mitigates order effects in within-subject experiments
7.8 Confirmatory and Exploratory Data Analysis
Exploratory data analysis
- enables you to find out potential patterns from collected data.
Confirmatory data analysis
- allows you to validate whether the collect pattern really holds.
7.9 Statistical Methods
Descriptive and inferential statistics
Descriptive statistics
- Use descriptive statistics to summarize and describe a group of numbers from a research study
Inferential statistics
- Use inferential statistics to draw conclusions and to make inferences that are based on the numbers from a research study but that go beyond the numbers.
- E.g., inferential statistics allow researchers to make inferences about a large group of individuals (i.e., population) based on a research study in which a much smaller number of individuals (i.e., sample) took part.
7.9.1 Descriptive Statistics
frequency table
- If the variable is discrete, frequency table can be built to give us some sense of the overall tendencies.
Central Tendency
The central tendency of a group of scores (a distribution) refers to the middle of the group of scores
Mean
- X stands for the scores in the distribution of the variable X • N stands for the number of scores in a distribution
Mode
- The mode is the most common single value in a distribution
Median
- If you line up all the scores from lowest to highest, the middle score is the median • If there are two middle scores, the median is the average of the two
Variance
- X stands for the scores in the distribution of the variable X
- M is the mean
- N stands for the number of scores in a distribution
Standard Deviation
- The square root of variance
7.10 Statistical Analysis
Mean and Variability
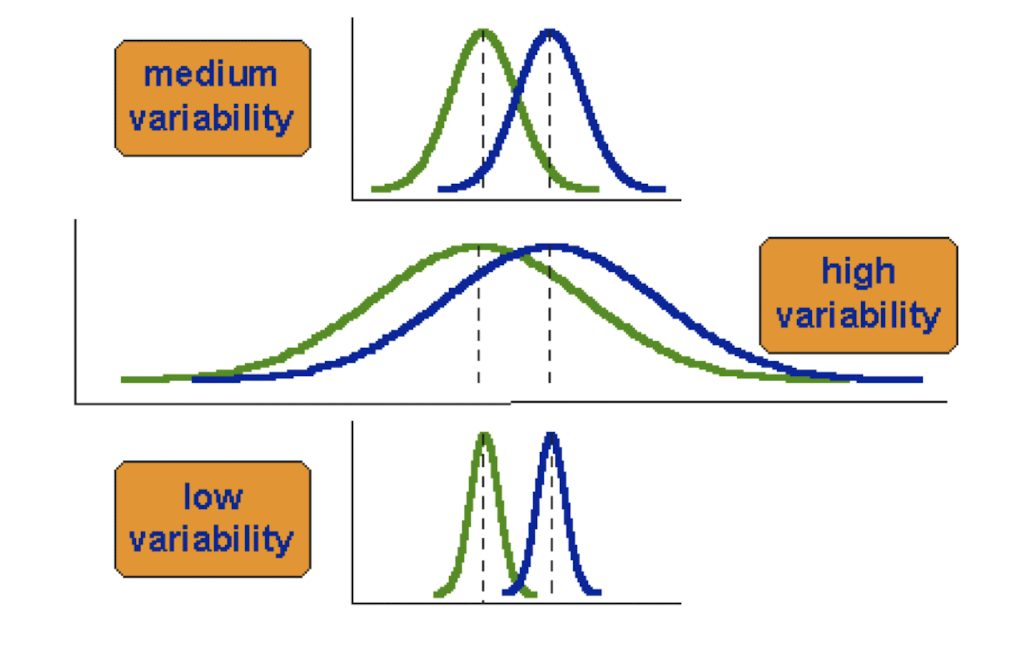
Signal vs Noise
Signal
- the difference between their means
- The change that we think that we introduced into the dataset by manipulating the independent variables.
Noise
- random factors beyond our control
- Given any dataset, there will always be some “noise”, so we cannot trust that the “signal” tells the story 100%.
t-test
- A simple statistical test that compares the difference between the means of two groups of data, taking the variability of the two groups into account.
- signal-noise ratio
- ratio is high enough (we have enough “signal” to compensate for the “noise”), then we can be more confident that the signal is trustworthy.
1. Independent sample t-test (a.k.a., two-sample t-test)
- compares the difference between the means of two groups of data, taking the variability of the two groups into account.
2. One sample t-test
- test the mean of a single group against a known mean
- $M_0$ is the known mean
- the standard error of the mean (SEM)
- SEM indicates how accurately your sample estimates the mean of the population
3. Paired sample t-test
- compare means from the same group at different times (e.g., one year apart) or different experiment conditions (e.g., iPhone vs Blackberry)
Interpret t-test Results
- Intuitively, the larger t is, the more significant the difference (or the signal) is, compared to the noise
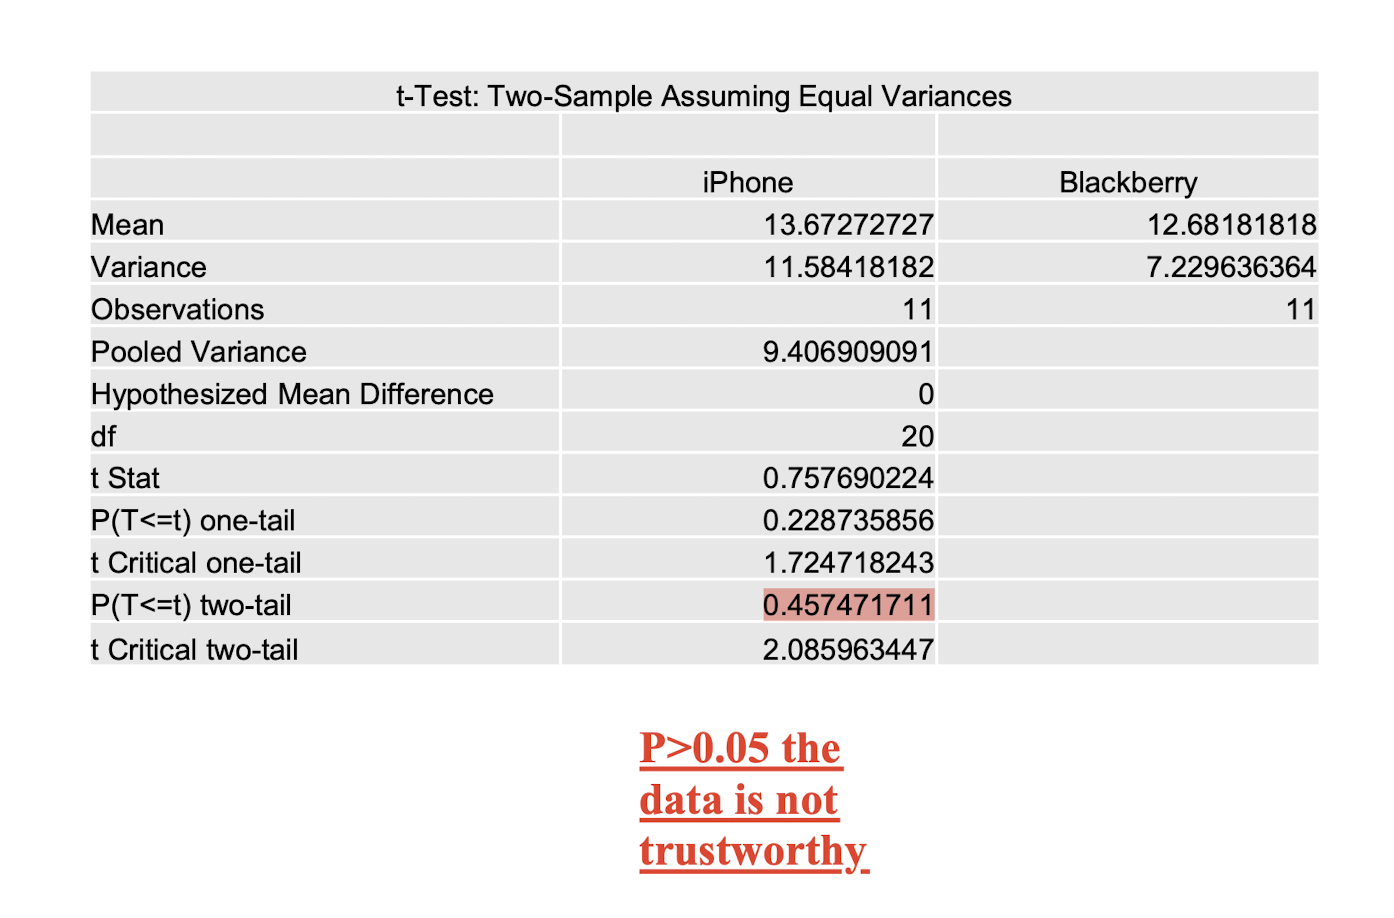
t-test Limitations
- Data points of each sample are normally distributed
- Not always the case, but t-test very robust in practice, due to central limit theorem.
- Population variances are equal
- t-test reasonably robust for differing variance, however, does deserve consideration, may use F-test to validate
- Individual observations of data points in sample are independent
- This is important!
- Significance level
- The t-test gives us the probability that the difference that we’re seeing between the data sets is not due to pure chance.
References
Slides of COMP3423 Human-Computer Interaction, The Hong Kong Polytechnic University, Dec 2022
个人笔记,仅供参考,转载请标明出处
PERSONAL COURSE NOTE, FOR REFERENCE ONLY
Made by Mike_Zhang